Gold
and Silver Charts
See my charts on gold and silver here: taluis.wordpress.com/charts
Enormous volume in Silver for the months of February-April, 2013. From:
NetDania.
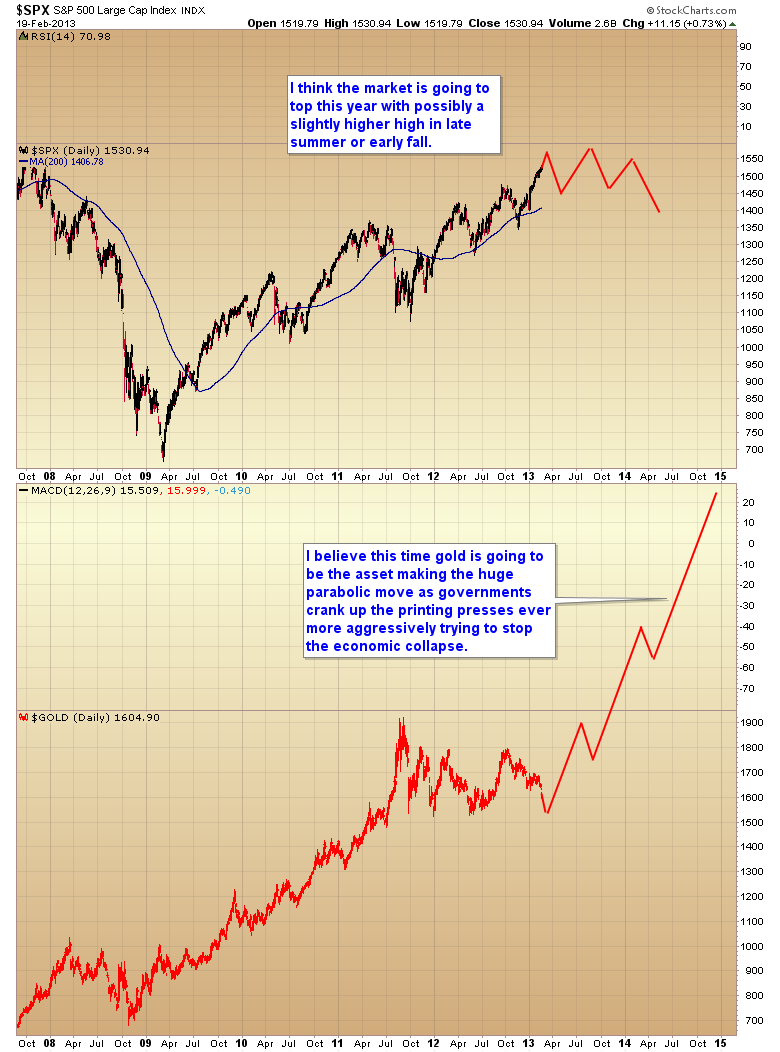
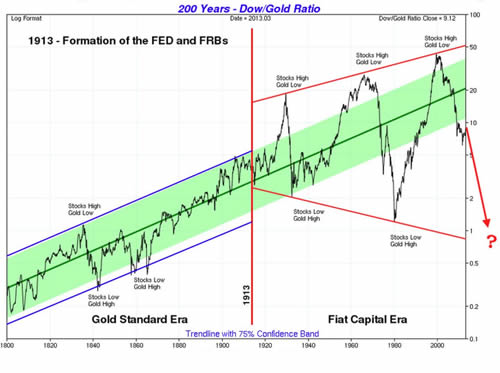
Stock market decline together with a gold parabolic cliimb in the 2014-2015
timeframe. The following chart is taken from this article: Major
Top in Stocks and Major Bottom in Gold.
.
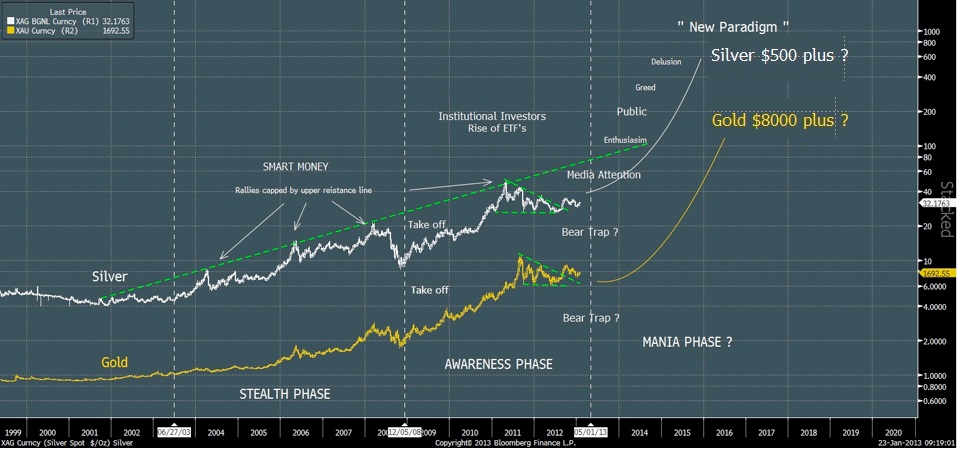
Gold/Silver mania phase possible in the 2015-2016 time period:
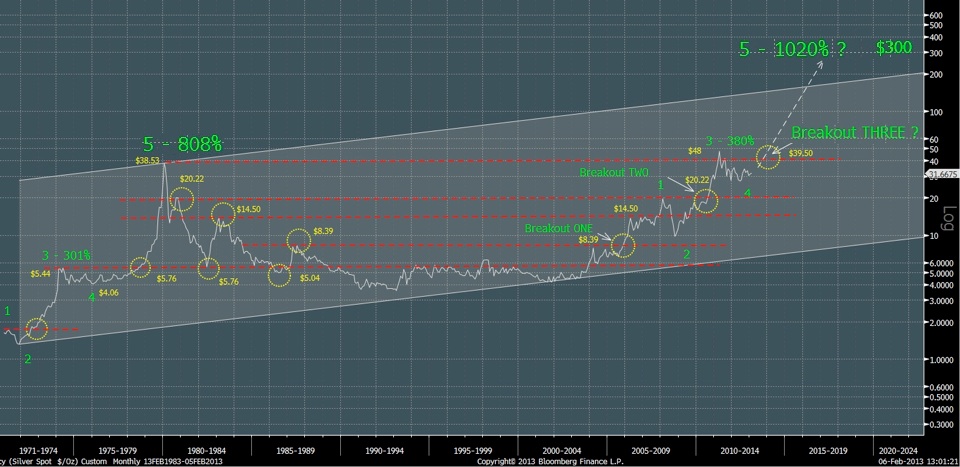
Very long term silver chart below (Exit
From Massive Silver Base Projects Staggering 1,020% Move). The latest
resistance tested, with a slight false break, was in April of 2011 at
the monthly closing level of $48. The previous all-time monthly closing
high was on Jan 31st, 1980 at $38.53 (although the intraday high was
slightly above $50). This price pattern indicates that the silver price
should move significantly higher on the next sustained break above the
$38.50 to $40 zone....The minimum topside target for silver is around
$200 which is the top of the major price channel.
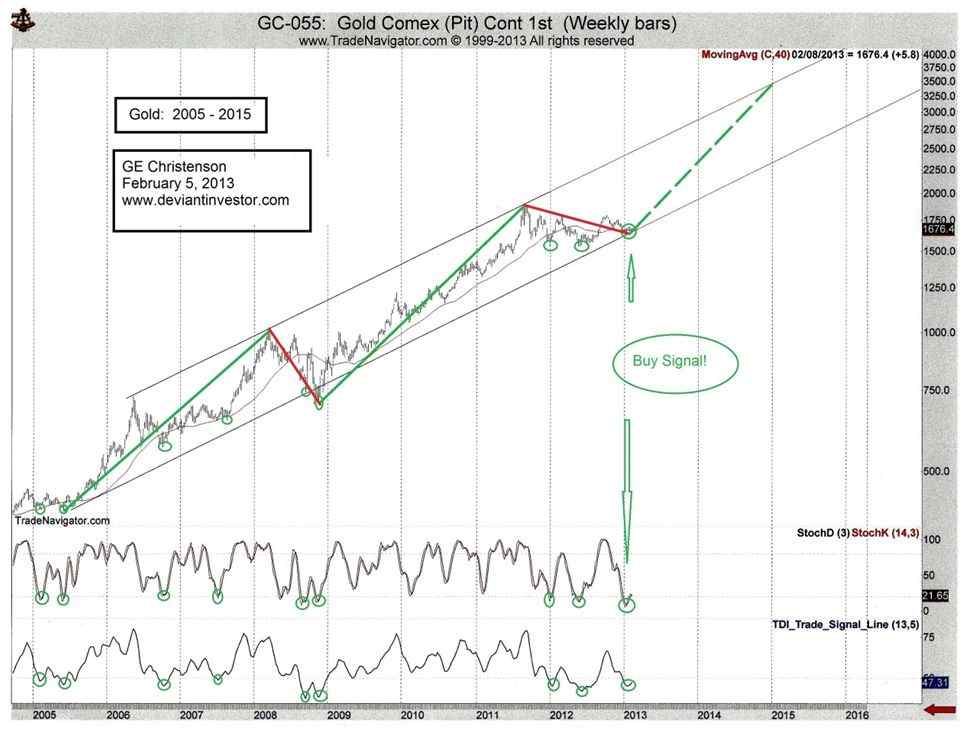
Gold
– Weekly Buy Signal: The weekly stochastic and TDI indicators
produced a “buy-signal” in the gold market (and various ETFs
for gold) in January 2013.
Gold
Market Update: The 7-year chart for gold shown below is very
interesting and useful as it reveals that gold can drop back down as
far as its lower supporting trendline and crucial strong support at
and above $1500, without it even putting a dent in its long-term bullmarket.
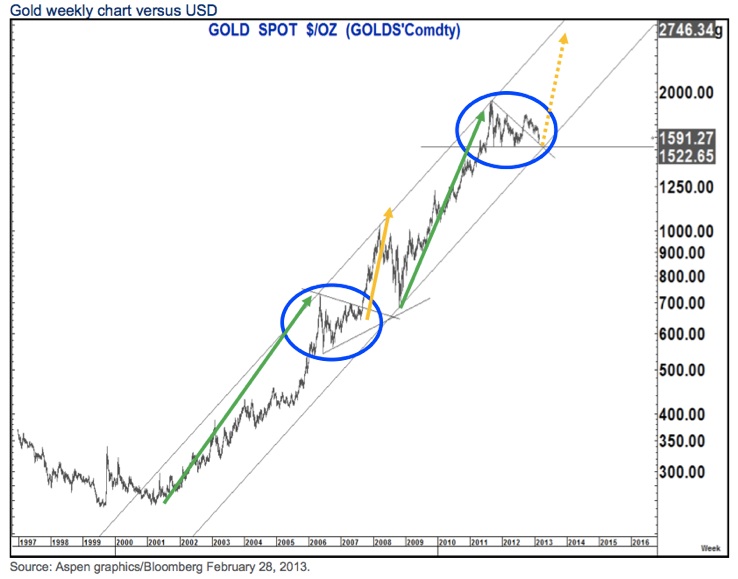
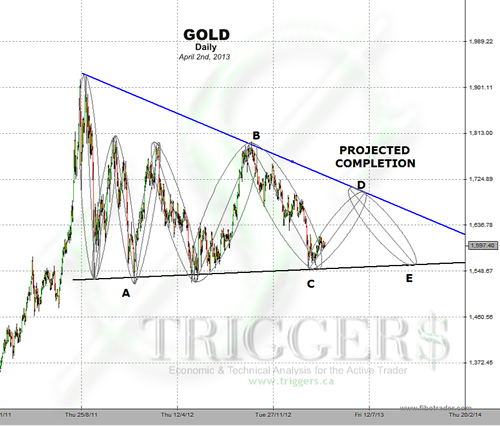
Special
Friday Gold ‘Chart Mania’: We continue to believe
that the present pattern in gold over the past 17 months remains similar
to that seen during the 16 month consolidation in 2006-2007 before it
moved higher again. Very strong support continues to exist in the $1,520-$1,530
area and we still believe this to be a platform for the next leg higher....it
is a break of the $1,790-1,800 area on a weekly close basis that would
signal a topside breakout. A move towards $2,055-2,060 would be the
target on that break.
What
OMF Means for GOLD: A lift in gold with a correcting equity
market should not be unexpected.
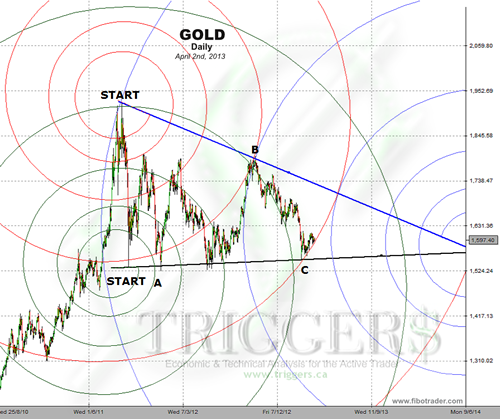
We do a lot of work with Fibonacci Ellipses and they have proven extremely
accurate within this central bank controlled environment which we are
presently witnessing. Our Fibonacci Spirals (below) has confirmed the
consolidation pattern with a high probability.
.
|